BENJAMIN BÖCKELMANN
ENDE

Projects

What I've built

My own projects are the best way to show how I work: from raw data to the right method to a chart you understand in five minutes.

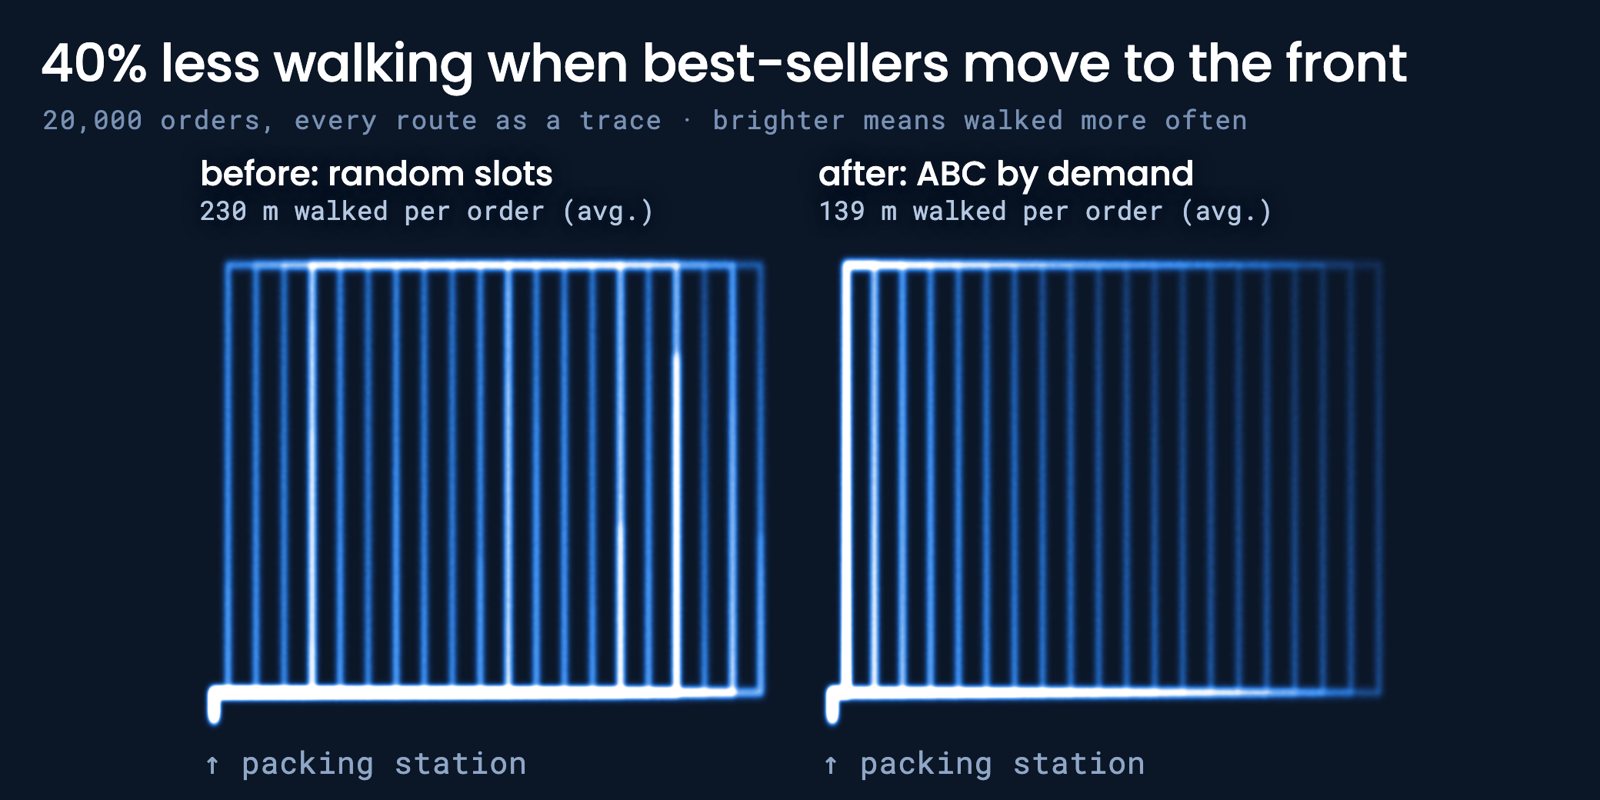
Warehouse simulation: walking routes before and after as bright traces

Simulation · Logistics

40% less walking in a warehouse, just by changing where items go

I simulated a warehouse with 20 aisles and 2,000 SKUs and ran 20,000 orders through standard S-shape picking. Moving best-sellers to the front cuts the walk per order from 230 to 139 meters. That adds up to about 1,100 miles and 420 labor hours saved per 20,000 orders.

  • Python
  • NumPy
  • Simulation
  • Routing
  • Data visualization
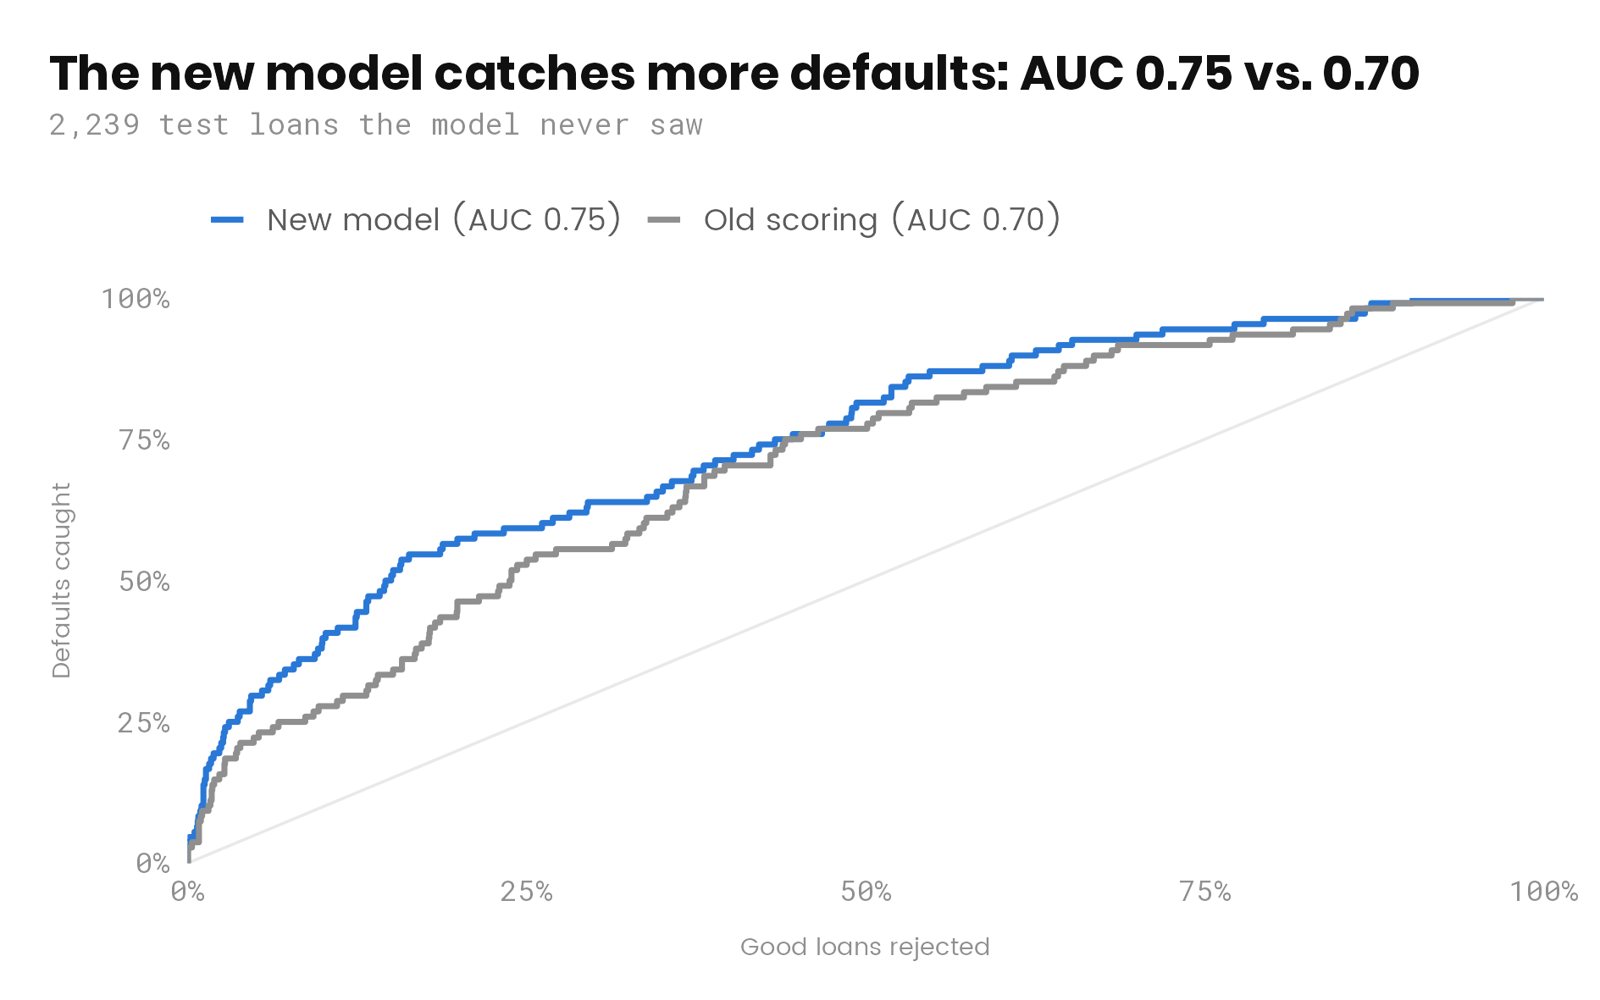
ROC curves: new credit model vs. the old scorecard

Case study · Banking

A credit model that spots defaults better than the old scorecard

In this case study, I built a default model from loan applications, account data and payment histories, and tested it on 2,239 later loans it had never seen. Along the way I caught a classic trap: one variable already knew the outcome and would have made the results look better than they are.

  • R
  • SQL
  • Logistic regression
  • AUC
  • Out-of-time validation
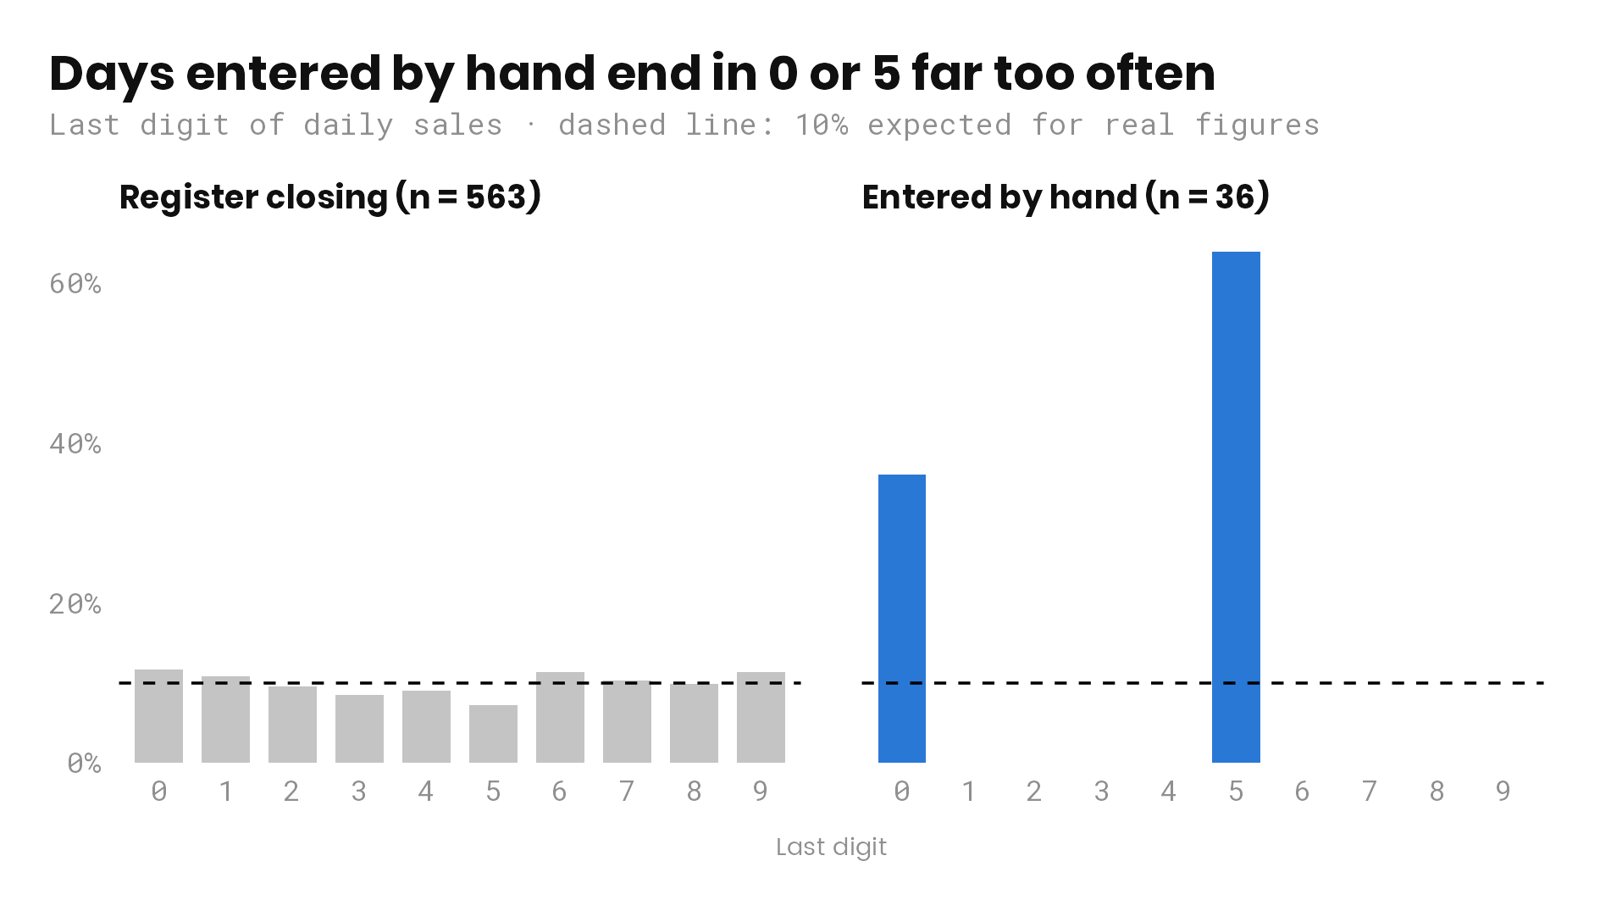
Last digits of daily sales: days entered by hand end almost only in 0 or 5

Case study · Tax advisory

Auditing a restaurant's register data before a tax audit

In this case study, I merge a restaurant's register, cash book, purchasing and bank data and check where an auditor would dig: duplicate invoices, days with a negative cash balance and sales that look estimated. A chi-square test on the last digits shows that the days entered by hand don't look like real numbers.

  • R
  • SQL
  • Chi-square test
  • Time series
  • Data validation
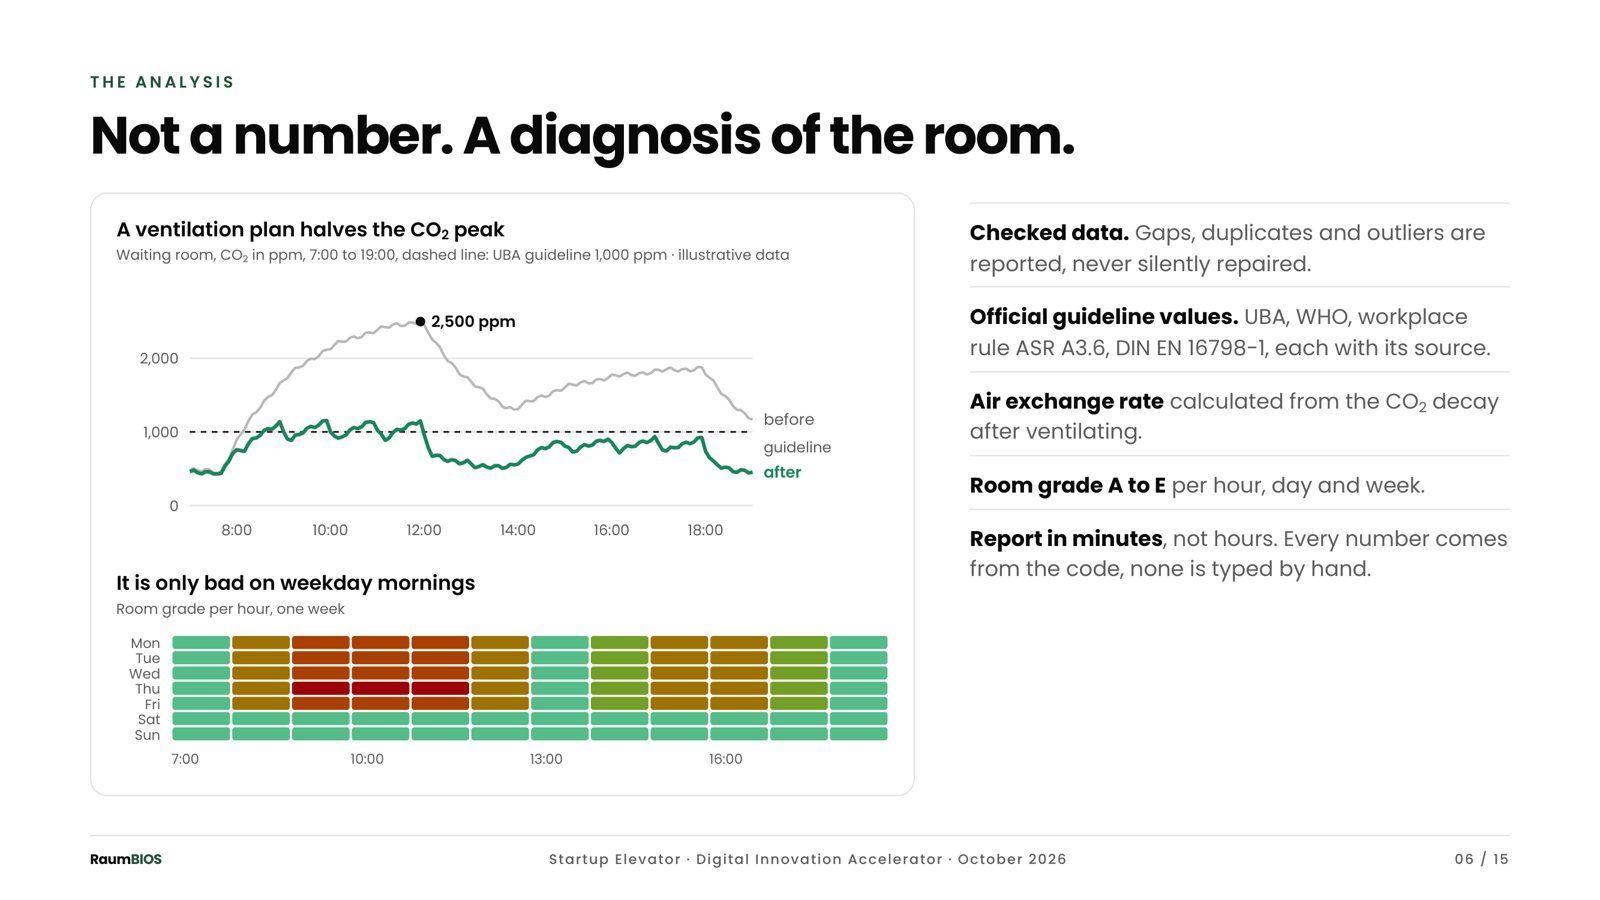
Slide from the RaumBIOS pitch deck: a CO₂ chart before and after a ventilation plan, and a heatmap by weekday

RaumBIOS · Indoor climate data

Turning sensor readings into answers

RaumBIOS measures indoor air quality. I built the analysis: checking the readings, flagging outliers and gaps, modeling trends and producing a finished report.

  • R
  • Regression
  • Bootstrap
  • Data validation
View project →
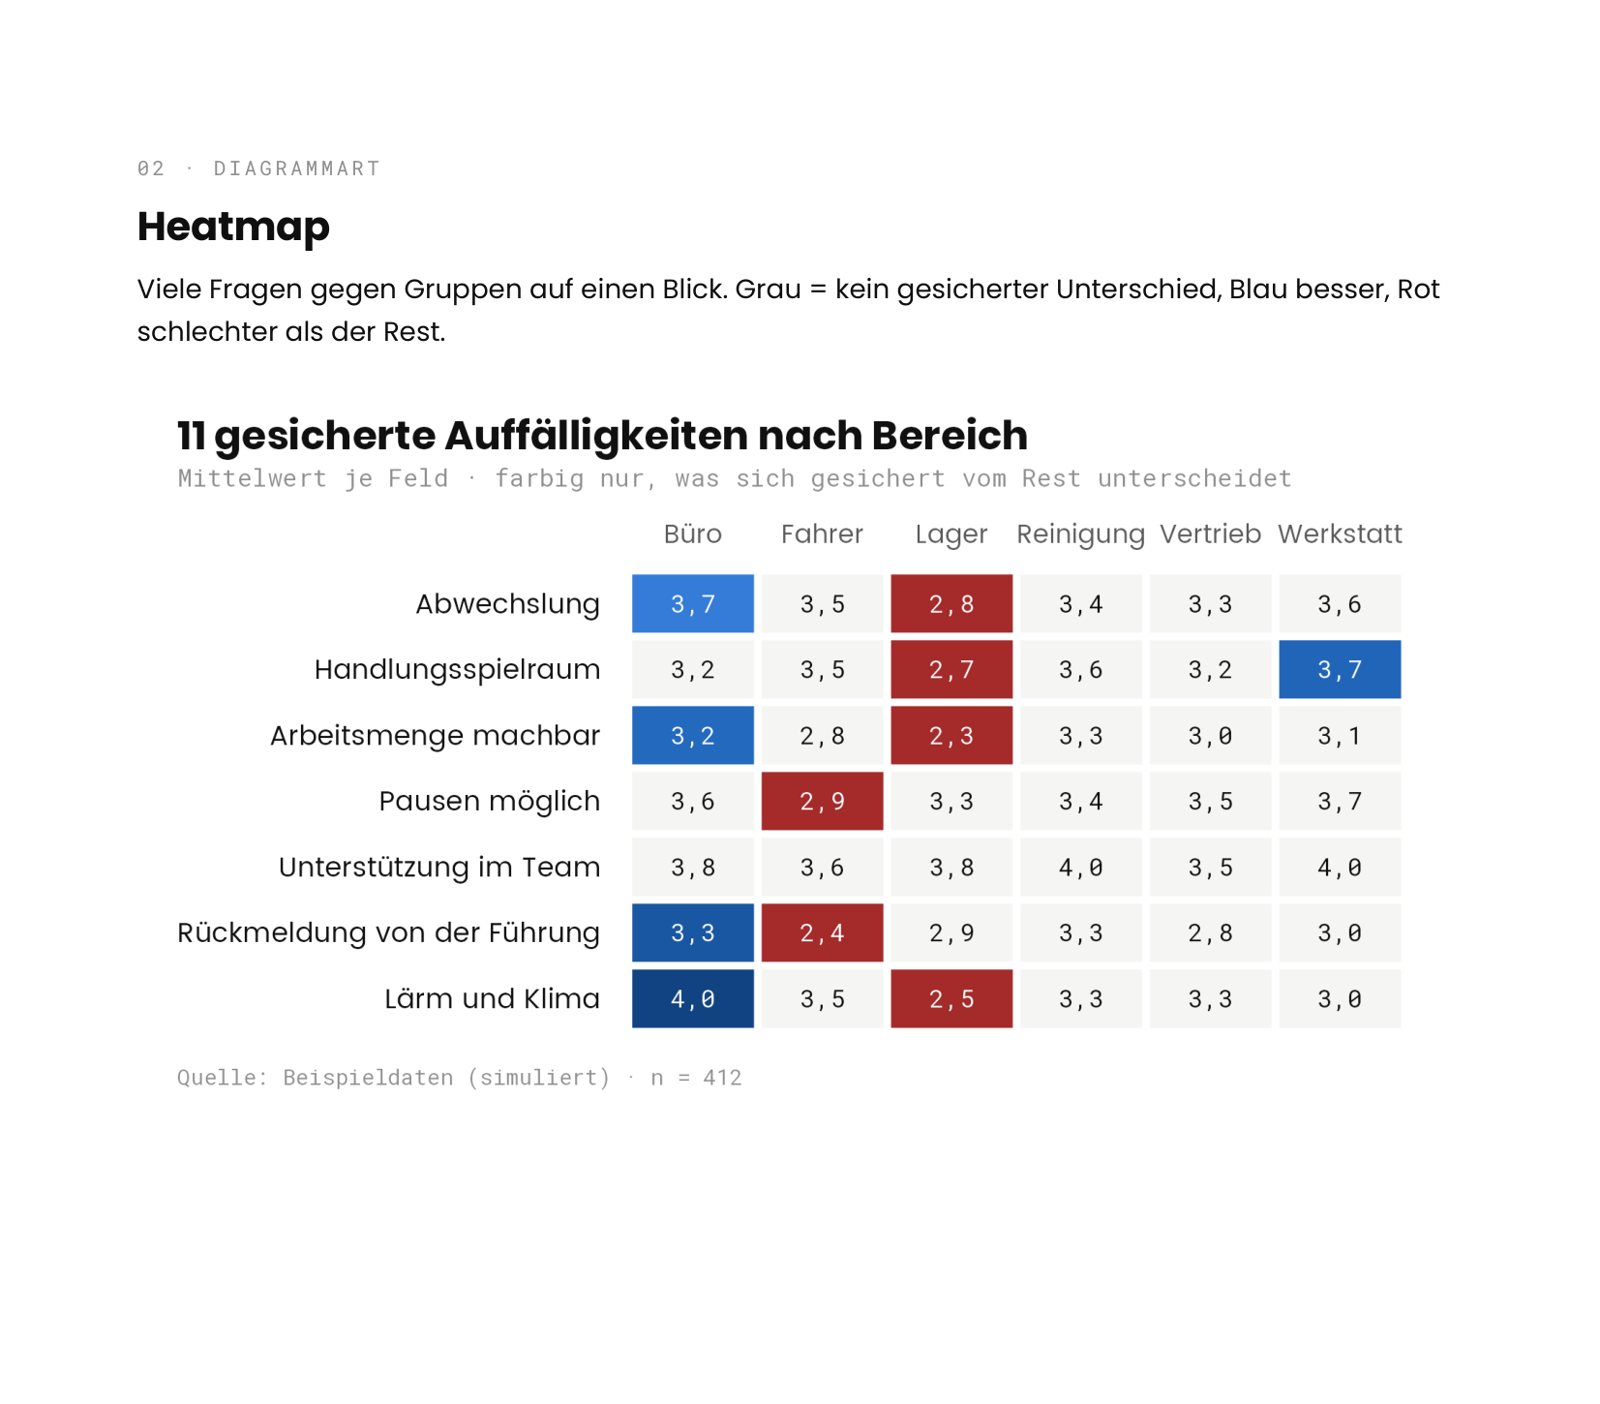
Page from the design kit (German example): a heatmap of significant differences and answer shares by group

In progress · MIXEDMOON

An analysis kit that turns a raw file into a finished report

What I'm building right now: an R toolkit with a small app. It reads an Excel or CSV file, checks the data, picks the right test for the columns, like Wilcoxon with Holm correction or chi-square with Cramér's V, and produces a report in one consistent design, white-label ready. I use it for my own work; it isn't a product yet.

  • R
  • ggplot2
  • Python
  • Statistical tests
  • Automation
Density map of 8.5 million delivery points in Austin, Texas

Large datasets

8.5 million delivery points, one picture

With millions of points, a normal chart turns into a blob. I aggregate them into densities on real streets, so the pattern shows at a glance: here, 69% of all orders come from a tenth of the city.

  • Python
  • OpenStreetMap
  • Density estimation
  • Large datasets

Tools

Tools I built for my own work

Bookkeeping app

Receipts, invoices as PDF and e-invoice (XRechnung) and the figures for the German tax return, ready to file. Runs locally in Python, no subscription.

This website

Generated entirely by a Python script. Bilingual, no cookies or tracking, and a strict Content Security Policy.

Inquiry form

Checks each inquiry against my rules right in the browser before it reaches my inbox. Built in PHP, no database.

Could this work with your data?