BENJAMIN BÖCKELMANN
ENDE

Data · Software · Brand

I make numbers visible.

I analyse large datasets, write the software to do it and build the presentation that makes the result convincing. For companies starting something new, and for investors who want to know beforehand whether it adds up.

7.5 mreadings in one analysis
100,000visitors simulated in milliseconds
0numbers typed in by hand
Benjamin Böckelmann

For companies and investors

Where I help

Launching a new product

You have an idea for a product or a new line of business. I use the data you have to test whether the assumptions hold, then build a first prototype and the presentation around it.

Checking the numbers before an investment

Before money moves, I recalculate the figures in a pitch deck or business plan and simulate what happens if an assumption doesn't come true.

Turning operating data into decisions

I bring together readings, sales or survey data, clean it and show in a few charts where something pays off. Like the RaumBIOS analysis further down.

Featured project

Dino Park Kreidetal: a season in data

The park doesn't exist and neither do its 12,152 visitors. Because I simulated the data myself, I know what's true and can show where a survey gets it wrong. With a simulator you can try.

12,152visitors in 120 days
92.9 %satisfied, says the tablet
78.1 %satisfied in truth
3T. rex (the raw list says 22)
Season calendarMoWeFrSuMayJunJulAug01.05.: 79 % satisfied, 94 visitors02.05.: 71 % satisfied, 115 visitors, heat03.05.: 75 % satisfied, 108 visitors04.05.: 85 % satisfied, 102 visitors05.05.: 81 % satisfied, 96 visitors06.05.: 69 % satisfied, 99 visitors, heat07.05.: 83 % satisfied, 102 visitors08.05.: 78 % satisfied, 88 visitors, heat09.05.: 81 % satisfied, 120 visitors10.05.: 80 % satisfied, 109 visitors11.05.: 82 % satisfied, 93 visitors12.05.: 88 % satisfied, 96 visitors13.05.: 85 % satisfied, 101 visitors14.05.: 75 % satisfied, 105 visitors15.05.: 81 % satisfied, 108 visitors16.05.: 78 % satisfied, 103 visitors17.05.: 85 % satisfied, 110 visitors18.05.: 85 % satisfied, 105 visitors19.05.: 85 % satisfied, 107 visitors20.05.: 80 % satisfied, 123 visitors21.05.: 77 % satisfied, 110 visitors22.05.: 75 % satisfied, 81 visitors23.05.: 85 % satisfied, 112 visitors24.05.: 72 % satisfied, 109 visitors, heat25.05.: 78 % satisfied, 107 visitors26.05.: 79 % satisfied, 109 visitors27.05.: 78 % satisfied, 79 visitors28.05.: 79 % satisfied, 84 visitors29.05.: 81 % satisfied, 109 visitors30.05.: 72 % satisfied, 90 visitors, heat31.05.: 66 % satisfied, 110 visitors, heat01.06.: 77 % satisfied, 110 visitors02.06.: 80 % satisfied, 95 visitors03.06.: 47 % satisfied, 95 visitors, raptor incident04.06.: 62 % satisfied, 96 visitors, heat05.06.: 81 % satisfied, 88 visitors06.06.: 74 % satisfied, 89 visitors07.06.: 80 % satisfied, 98 visitors08.06.: 88 % satisfied, 112 visitors09.06.: 81 % satisfied, 102 visitors10.06.: 37 % satisfied, 107 visitors, raptor incident, heat11.06.: 77 % satisfied, 106 visitors12.06.: 73 % satisfied, 113 visitors13.06.: 85 % satisfied, 99 visitors14.06.: 84 % satisfied, 103 visitors15.06.: 69 % satisfied, 102 visitors, heat16.06.: 63 % satisfied, 89 visitors, heat17.06.: 76 % satisfied, 102 visitors18.06.: 81 % satisfied, 119 visitors19.06.: 85 % satisfied, 108 visitors20.06.: 72 % satisfied, 95 visitors, heat21.06.: 75 % satisfied, 110 visitors22.06.: 65 % satisfied, 119 visitors, heat23.06.: 82 % satisfied, 130 visitors24.06.: 88 % satisfied, 104 visitors25.06.: 48 % satisfied, 89 visitors, raptor incident26.06.: 84 % satisfied, 92 visitors27.06.: 84 % satisfied, 109 visitors28.06.: 82 % satisfied, 98 visitors29.06.: 88 % satisfied, 96 visitors30.06.: 71 % satisfied, 94 visitors, heat01.07.: 89 % satisfied, 100 visitors02.07.: 60 % satisfied, 108 visitors, heat03.07.: 81 % satisfied, 105 visitors04.07.: 89 % satisfied, 103 visitors05.07.: 86 % satisfied, 101 visitors06.07.: 64 % satisfied, 94 visitors, heat07.07.: 88 % satisfied, 107 visitors08.07.: 82 % satisfied, 106 visitors09.07.: 66 % satisfied, 107 visitors, heat10.07.: 87 % satisfied, 90 visitors11.07.: 83 % satisfied, 113 visitors12.07.: 82 % satisfied, 90 visitors13.07.: 82 % satisfied, 95 visitors14.07.: 89 % satisfied, 85 visitors15.07.: 86 % satisfied, 100 visitors16.07.: 92 % satisfied, 103 visitors17.07.: 72 % satisfied, 98 visitors, heat18.07.: 84 % satisfied, 130 visitors19.07.: 79 % satisfied, 96 visitors20.07.: 30 % satisfied, 110 visitors, raptor incident, heat21.07.: 81 % satisfied, 100 visitors22.07.: 81 % satisfied, 107 visitors23.07.: 86 % satisfied, 87 visitors24.07.: 72 % satisfied, 97 visitors, heat25.07.: 72 % satisfied, 106 visitors, heat26.07.: 82 % satisfied, 101 visitors27.07.: 87 % satisfied, 104 visitors28.07.: 80 % satisfied, 102 visitors29.07.: 82 % satisfied, 97 visitors30.07.: 95 % satisfied, 105 visitors31.07.: 62 % satisfied, 96 visitors, heat01.08.: 78 % satisfied, 100 visitors02.08.: 87 % satisfied, 100 visitors03.08.: 62 % satisfied, 100 visitors, heat04.08.: 81 % satisfied, 93 visitors05.08.: 84 % satisfied, 91 visitors06.08.: 78 % satisfied, 112 visitors07.08.: 82 % satisfied, 92 visitors08.08.: 88 % satisfied, 100 visitors09.08.: 82 % satisfied, 91 visitors10.08.: 81 % satisfied, 100 visitors11.08.: 86 % satisfied, 102 visitors12.08.: 86 % satisfied, 90 visitors13.08.: 70 % satisfied, 89 visitors, heat14.08.: 79 % satisfied, 104 visitors15.08.: 83 % satisfied, 101 visitors16.08.: 86 % satisfied, 94 visitors17.08.: 79 % satisfied, 97 visitors18.08.: 70 % satisfied, 83 visitors, heat19.08.: 75 % satisfied, 99 visitors20.08.: 84 % satisfied, 119 visitors21.08.: 61 % satisfied, 99 visitors, heat22.08.: 80 % satisfied, 91 visitors23.08.: 86 % satisfied, 96 visitors24.08.: 78 % satisfied, 105 visitors25.08.: 89 % satisfied, 82 visitors26.08.: 79 % satisfied, 130 visitors27.08.: 77 % satisfied, 98 visitors28.08.: 84 % satisfied, 98 visitors

Read the analysis →

RaumBIOS · Product idea

Indoor air as a data product.

Anyone running schools, offices or care homes needs to know which rooms have bad air and where ventilation pays off. RaumBIOS is meant to answer that from sensor data. This is what the analysis would look like for a building portfolio, computed with simulated data.

7.5 million readings and one question: where should the money go?

Six buildings, 48 rooms, CO₂, humidity and temperature every ten minutes for a year. The data is simulated, the question is real: which rooms need ventilation and which don't?

7,568,640readings in one year
48 / 6rooms / buildings
50 %of all problem hours in 5 rooms
27rooms need no investment

When the air turns bad

How many of the 48 rooms are occupied and above 1,400 ppm CO₂. One day per column, one hour per row. At night a few bedrooms are affected, during the day the full classrooms and offices. Holidays and weekends show up as calmer stripes.

Problem hours by day and hourJanFebMarAprMayJunJulAugSepOctNovDec00:0006:0012:0018:00
  • no room
  • 1 to 5 rooms
  • 6 to 10 rooms
  • more than 10 rooms

Where the money should go

Problem hours per room, sorted. In red are the five rooms that account for half of all problem hours. The line shows the cumulative share.

Pareto of problem hours02,0004,0006,0008,0000 %50 %100 %Pflegeheim 04: 7,855 problem hoursWohnblock 08: 5,526 problem hoursWohnblock 06: 4,974 problem hoursWohnblock 05: 3,410 problem hoursKita 04: 2,242 problem hoursBürohaus 03: 2,176 problem hoursBürohaus 02: 2,169 problem hoursKita 01: 2,166 problem hoursKita 03: 2,164 problem hoursKita 02: 2,162 problem hoursKita 05: 1,961 problem hoursVerwaltung 05: 1,895 problem hoursPflegeheim 08: 1,422 problem hoursSchule 06: 1,359 problem hoursSchule 03: 1,326 problem hoursSchule 04: 1,313 problem hoursSchule 02: 1,252 problem hoursSchule 05: 1,208 problem hoursKita 08: 837 problem hoursSchule 08: 409 problem hoursVerwaltung 04: 103 problem hoursVerwaltung 06: 2 problem hoursSchule 01: 0 problem hoursSchule 07: 0 problem hoursBürohaus 01: 0 problem hoursBürohaus 04: 0 problem hoursBürohaus 05: 0 problem hoursBürohaus 06: 0 problem hoursBürohaus 07: 0 problem hoursBürohaus 08: 0 problem hoursKita 06: 0 problem hoursKita 07: 0 problem hoursPflegeheim 01: 0 problem hoursPflegeheim 02: 0 problem hoursPflegeheim 03: 0 problem hoursPflegeheim 05: 0 problem hoursPflegeheim 06: 0 problem hoursPflegeheim 07: 0 problem hoursWohnblock 01: 0 problem hoursWohnblock 02: 0 problem hoursWohnblock 03: 0 problem hoursWohnblock 04: 0 problem hoursWohnblock 07: 0 problem hoursVerwaltung 01: 0 problem hoursVerwaltung 02: 0 problem hoursVerwaltung 03: 0 problem hoursVerwaltung 07: 0 problem hoursVerwaltung 08: 0 problem hoursrooms, sorted by problem hours →

The typical week

Mean CO₂ of occupied rooms by weekday and hour. Grey means below 1,400 ppm, warm means above.

CO₂ over the week00061218MoMo 00:00 · 1,222 ppmMo 01:00 · 1,221 ppmMo 02:00 · 1,221 ppmMo 03:00 · 1,222 ppmMo 04:00 · 1,221 ppmMo 05:00 · 1,219 ppmMo 06:00 · 1,219 ppmMo 07:00 · 1,066 ppmMo 08:00 · 1,107 ppmMo 09:00 · 1,436 ppmMo 10:00 · 1,350 ppmMo 11:00 · 1,622 ppmMo 12:00 · 1,480 ppmMo 13:00 · 1,725 ppmMo 14:00 · 1,842 ppmMo 15:00 · 1,531 ppmMo 16:00 · 1,190 ppmMo 17:00 · 1,051 ppmMo 18:00 · 935 ppmMo 19:00 · 1,100 ppmMo 20:00 · 1,166 ppmMo 21:00 · 1,195 ppmMo 22:00 · 1,208 ppmMo 23:00 · 1,215 ppmTuTu 00:00 · 1,219 ppmTu 01:00 · 1,221 ppmTu 02:00 · 1,221 ppmTu 03:00 · 1,220 ppmTu 04:00 · 1,220 ppmTu 05:00 · 1,221 ppmTu 06:00 · 1,220 ppmTu 07:00 · 1,106 ppmTu 08:00 · 1,133 ppmTu 09:00 · 1,455 ppmTu 10:00 · 1,364 ppmTu 11:00 · 1,633 ppmTu 12:00 · 1,491 ppmTu 13:00 · 1,732 ppmTu 14:00 · 1,848 ppmTu 15:00 · 1,537 ppmTu 16:00 · 1,193 ppmTu 17:00 · 1,051 ppmTu 18:00 · 934 ppmTu 19:00 · 1,098 ppmTu 20:00 · 1,165 ppmTu 21:00 · 1,193 ppmTu 22:00 · 1,208 ppmTu 23:00 · 1,215 ppmWeWe 00:00 · 1,220 ppmWe 01:00 · 1,222 ppmWe 02:00 · 1,221 ppmWe 03:00 · 1,220 ppmWe 04:00 · 1,219 ppmWe 05:00 · 1,220 ppmWe 06:00 · 1,223 ppmWe 07:00 · 1,103 ppmWe 08:00 · 1,133 ppmWe 09:00 · 1,458 ppmWe 10:00 · 1,366 ppmWe 11:00 · 1,637 ppmWe 12:00 · 1,494 ppmWe 13:00 · 1,737 ppmWe 14:00 · 1,853 ppmWe 15:00 · 1,537 ppmWe 16:00 · 1,193 ppmWe 17:00 · 1,050 ppmWe 18:00 · 935 ppmWe 19:00 · 1,100 ppmWe 20:00 · 1,167 ppmWe 21:00 · 1,197 ppmWe 22:00 · 1,208 ppmWe 23:00 · 1,214 ppmThTh 00:00 · 1,209 ppmTh 01:00 · 1,214 ppmTh 02:00 · 1,216 ppmTh 03:00 · 1,218 ppmTh 04:00 · 1,219 ppmTh 05:00 · 1,221 ppmTh 06:00 · 1,223 ppmTh 07:00 · 1,105 ppmTh 08:00 · 1,131 ppmTh 09:00 · 1,455 ppmTh 10:00 · 1,366 ppmTh 11:00 · 1,634 ppmTh 12:00 · 1,491 ppmTh 13:00 · 1,731 ppmTh 14:00 · 1,846 ppmTh 15:00 · 1,537 ppmTh 16:00 · 1,194 ppmTh 17:00 · 1,052 ppmTh 18:00 · 934 ppmTh 19:00 · 1,100 ppmTh 20:00 · 1,166 ppmTh 21:00 · 1,196 ppmTh 22:00 · 1,209 ppmTh 23:00 · 1,216 ppmFrFr 00:00 · 1,220 ppmFr 01:00 · 1,220 ppmFr 02:00 · 1,221 ppmFr 03:00 · 1,220 ppmFr 04:00 · 1,221 ppmFr 05:00 · 1,222 ppmFr 06:00 · 1,218 ppmFr 07:00 · 1,106 ppmFr 08:00 · 1,134 ppmFr 09:00 · 1,459 ppmFr 10:00 · 1,366 ppmFr 11:00 · 1,636 ppmFr 12:00 · 1,492 ppmFr 13:00 · 1,735 ppmFr 14:00 · 1,851 ppmFr 15:00 · 1,536 ppmFr 16:00 · 1,193 ppmFr 17:00 · 1,050 ppmFr 18:00 · 937 ppmFr 19:00 · 1,102 ppmFr 20:00 · 1,168 ppmFr 21:00 · 1,195 ppmFr 22:00 · 1,209 ppmFr 23:00 · 1,217 ppmSaSa 00:00 · 1,218 ppmSa 01:00 · 1,219 ppmSa 02:00 · 1,219 ppmSa 03:00 · 1,220 ppmSa 04:00 · 1,222 ppmSa 05:00 · 1,221 ppmSa 06:00 · 1,222 ppmSa 07:00 · 1,051 ppmSa 08:00 · 1,052 ppmSa 09:00 · 990 ppmSa 10:00 · 936 ppmSa 11:00 · 1,108 ppmSa 12:00 · 967 ppmSa 13:00 · 1,120 ppmSa 14:00 · 1,180 ppmSa 15:00 · 1,201 ppmSa 16:00 · 1,211 ppmSa 17:00 · 1,216 ppmSa 18:00 · 1,218 ppmSa 19:00 · 1,220 ppmSa 20:00 · 1,222 ppmSa 21:00 · 1,220 ppmSa 22:00 · 1,221 ppmSa 23:00 · 1,221 ppmSuSu 00:00 · 1,222 ppmSu 01:00 · 1,220 ppmSu 02:00 · 1,219 ppmSu 03:00 · 1,221 ppmSu 04:00 · 1,222 ppmSu 05:00 · 1,223 ppmSu 06:00 · 1,222 ppmSu 07:00 · 1,054 ppmSu 08:00 · 1,053 ppmSu 09:00 · 990 ppmSu 10:00 · 936 ppmSu 11:00 · 1,108 ppmSu 12:00 · 967 ppmSu 13:00 · 1,119 ppmSu 14:00 · 1,177 ppmSu 15:00 · 1,200 ppmSu 16:00 · 1,214 ppmSu 17:00 · 1,219 ppmSu 18:00 · 1,221 ppmSu 19:00 · 1,220 ppmSu 20:00 · 1,219 ppmSu 21:00 · 1,221 ppmSu 22:00 · 1,222 ppmSu 23:00 · 1,222 ppm
Five rooms first

They account for half of the problem hours. That's where ventilation pays off first.

Nights get tight

In the bedrooms of the care home and the flats, CO₂ keeps rising all night.

27 rooms need nothing

Every euro spent on ventilation there would be wasted.

Simulation in R · mass balance per room · 52,560 time steps × 48 rooms

Large datasets

Charts that stay readable at 200,000 rows

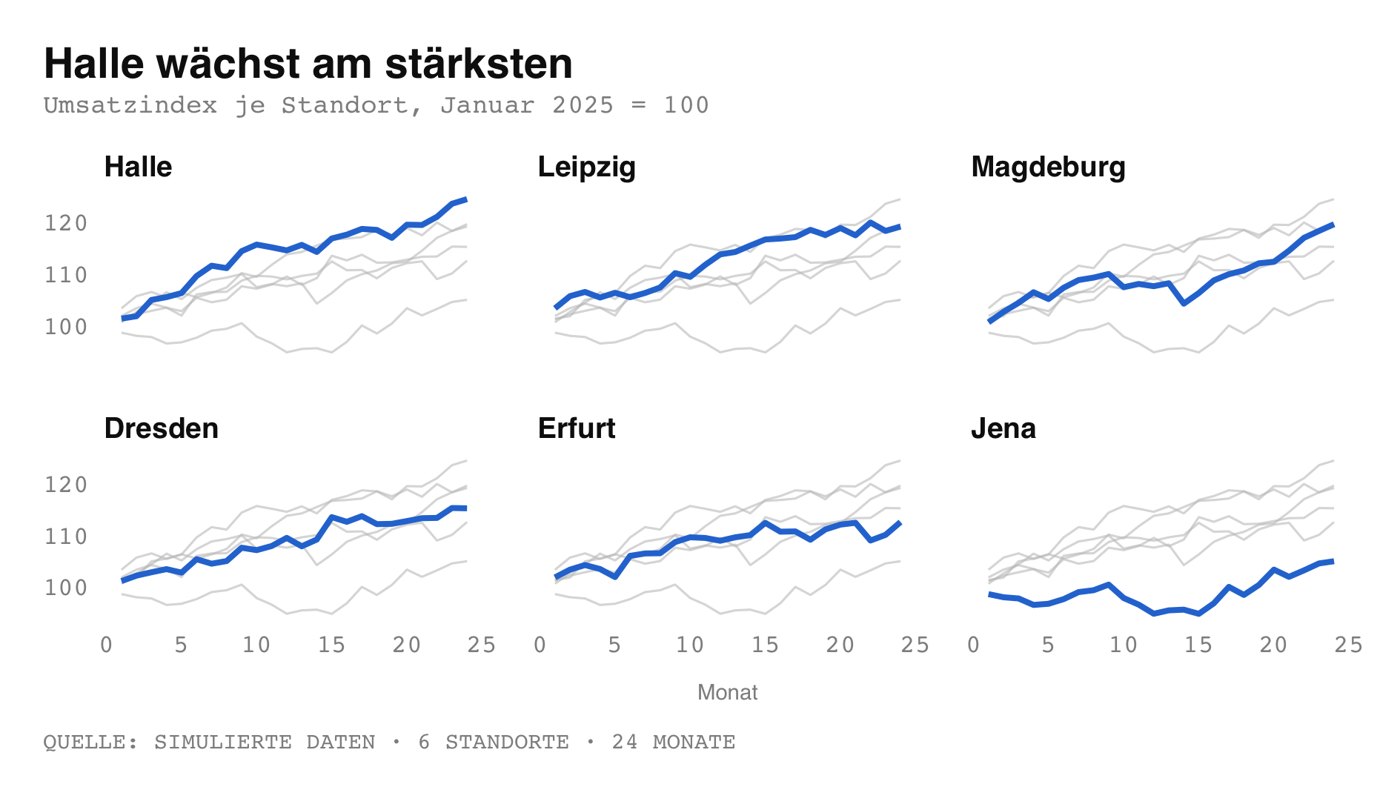
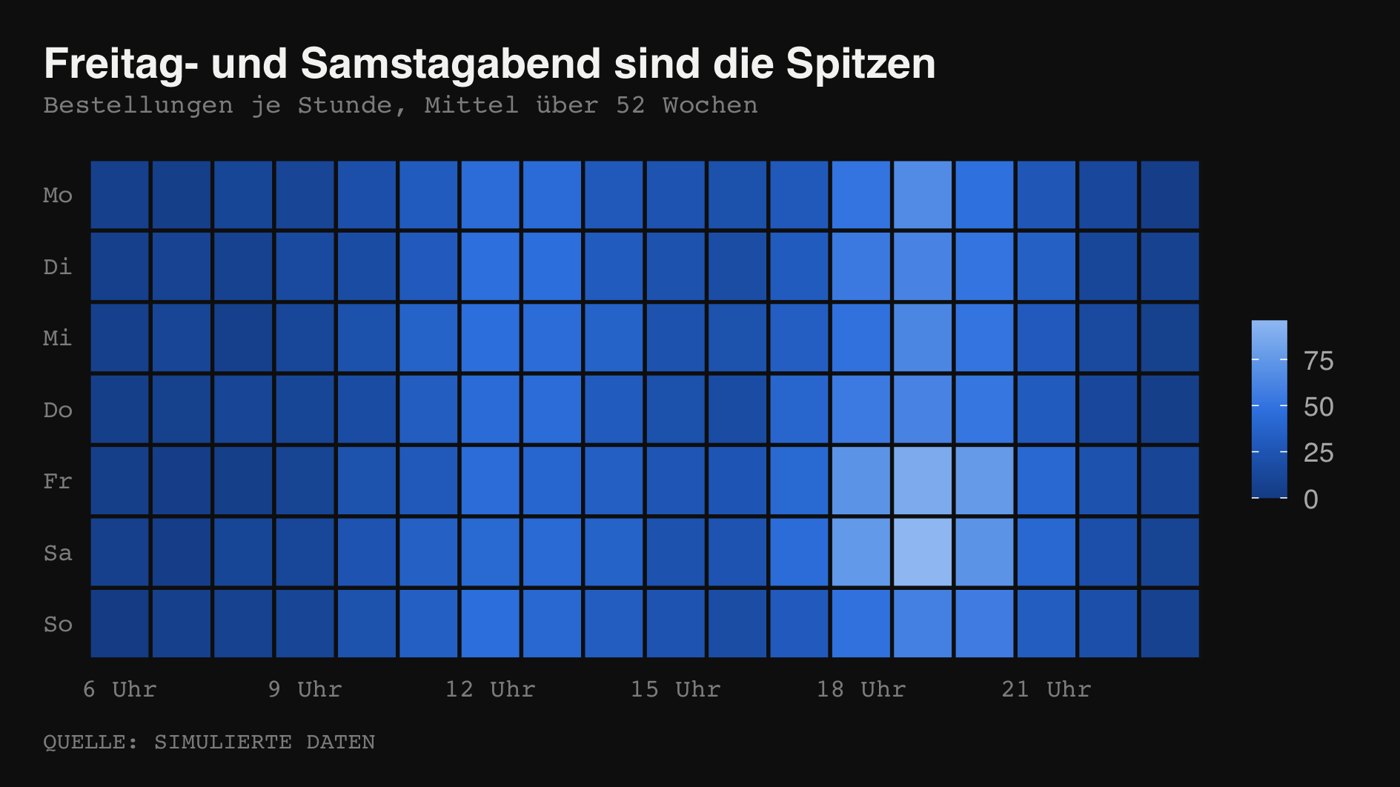
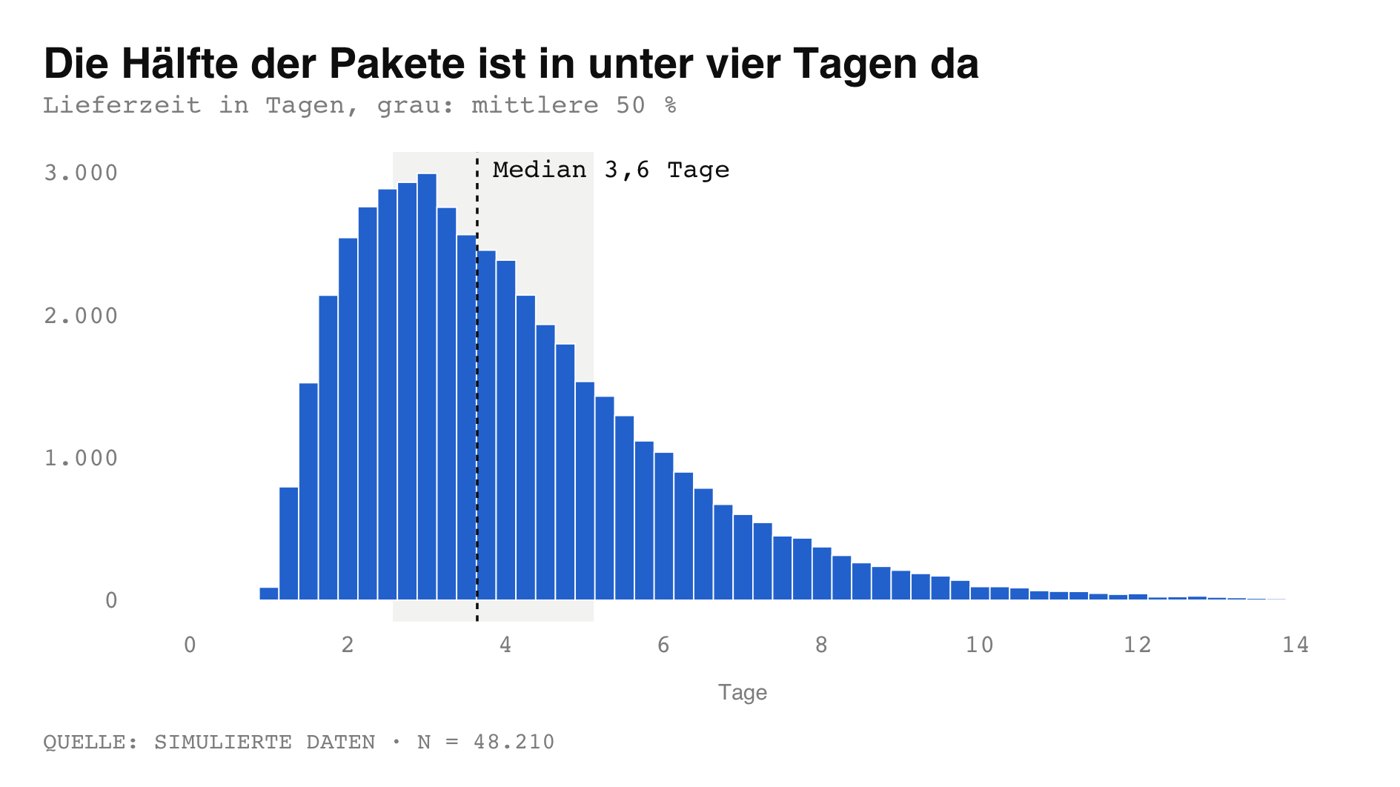
With 200,000 points a normal scatter plot is just a blob. So I use densities, distributions and small multiples. Built in R with simulated data.
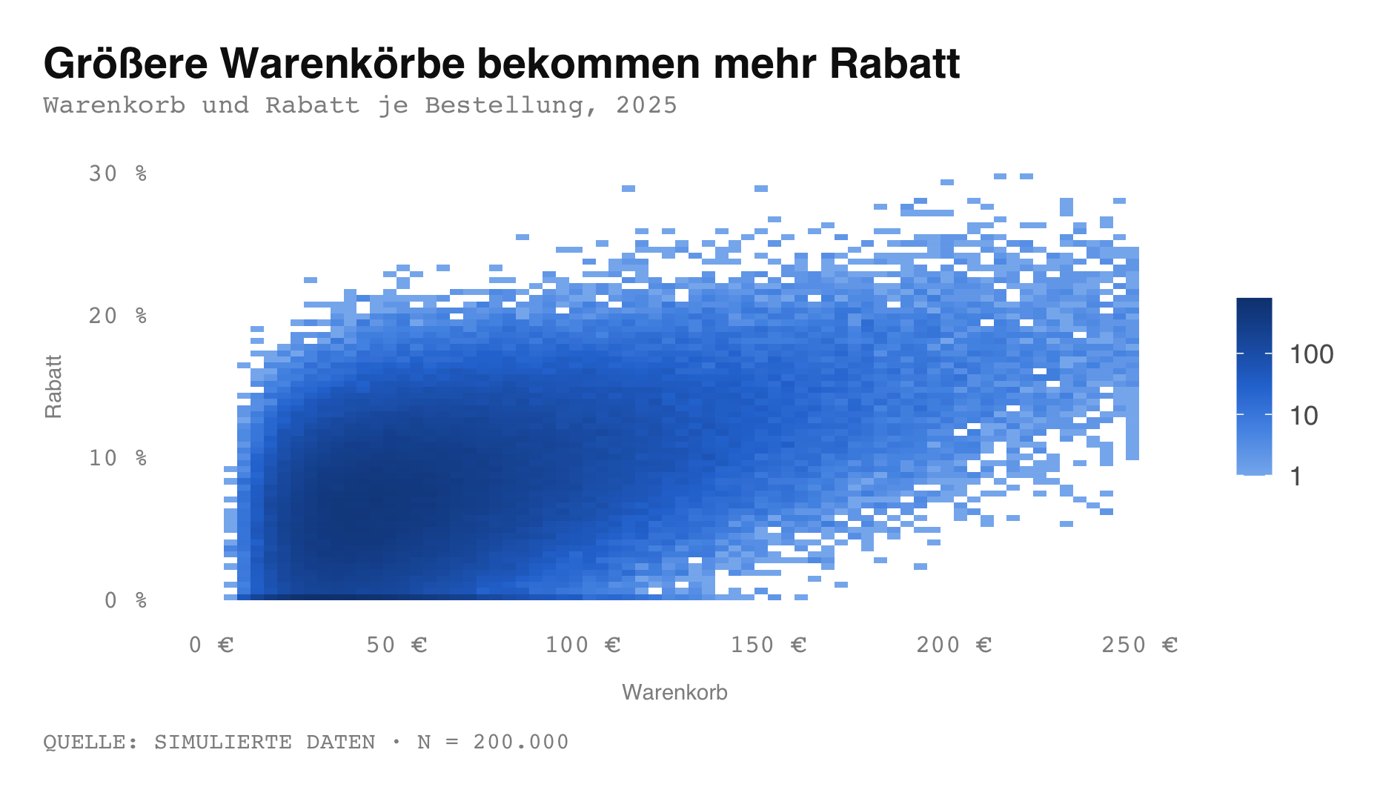
200,000 orders as a density map
48,210 delivery times as a distribution
6 locations over 24 months as small multiples
52 weeks of orders per hour as a heatmap

What I bring

From raw data to the finished page.

Data and statistics

I pull data from spreadsheets, databases or by scraping websites, clean it and fit models. What matters to me is telling real effects from chance, whether it's 200 survey answers or millions of readings.

  • R
  • SQL
  • Web scraping
  • Regression
  • Simulation
  • Tests

Software and automation

I write scripts that turn raw data into finished results with one command, and tools that run right in the browser. This website is generated by a Python script too, page by page.

  • R
  • Python
  • JavaScript
  • HTML and CSS
  • Git

Brand and marketing

I built the logo, design system and website for myself and for J&B Raumbiologie. I know how to show numbers so people get them, and how to turn them into a post people read.

  • Branding
  • Design system
  • Websites
  • Content
  • Campaigns

How I work

Three rules I stick to.

Every number comes from a script.

I don't type anything in by hand. If someone repeats the analysis next year, they get the same result.

I say when something could be chance.

I only highlight results that hold up statistically.

I use AI and check everything myself.

AI helps me with code and design. I still check every number and every statement myself.
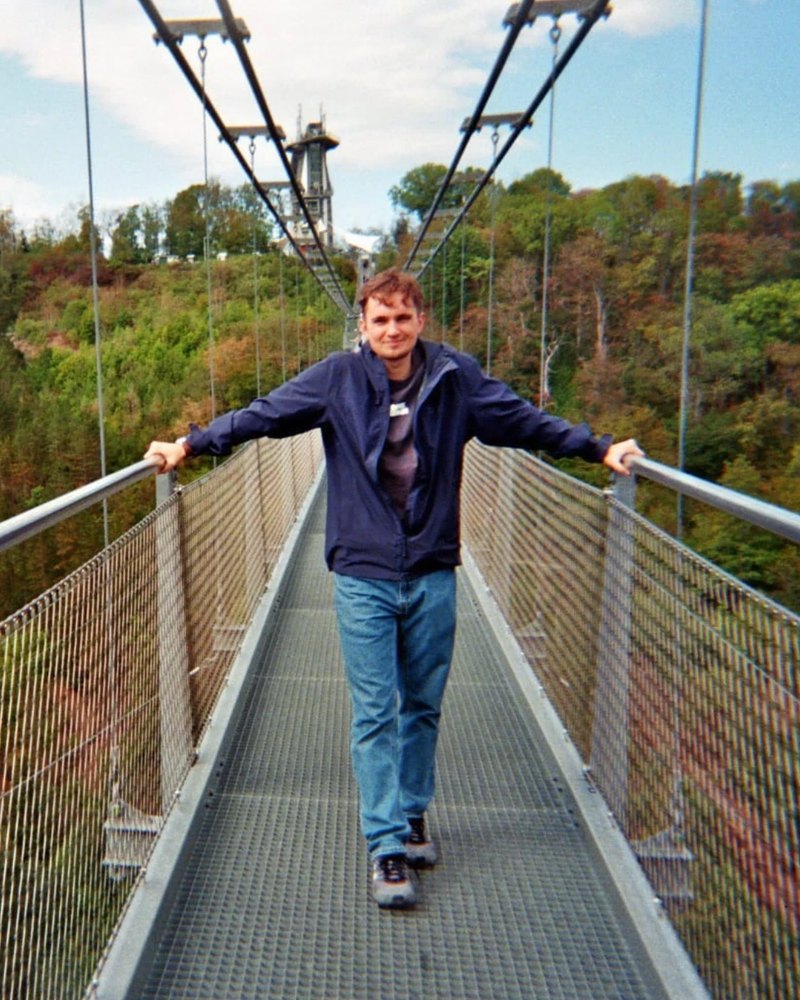
Benjamin Böckelmann on a suspension bridge

About

Who does the maths

I'm Benjamin Böckelmann. I like to double-check numbers, even when nobody asks, and I like building things you can use: tools, brands, websites.

My favourite film is Jurassic Park. That's why my biggest statistics project has a dino park, and why someone there ends up counting how many T. rex there really are.

Open to
Projects with companies and investors, partnerships for new products, roles in data and software
Languages
German (native), English (C1), Spanish (B1)
Tools
R every day, plus LaTeX, HTML, CSS and JavaScript, basics of SQL and Python
Experience
Co-founder of J&B Raumbiologie: analytics, branding, public presence and software

MIXEDMOON

The big project · Vision

Scale it to the moon.

MIXEDMOON is meant to become a consultancy that brings analytics, software and brand together. Nothing is founded yet. It's my long-term goal and I'm working towards it.

Contact

Let's talk.

Planning a product, a company or an investment and need someone to run the numbers and build something from them? Type contact below and your message goes straight to my inbox.

The terminal needs JavaScript. Just send me an email: mail@benjaminboeckelmann.de