Check the data first
The analysis detects duplicate timestamps, impossible values and gaps on its own. It never repairs anything silently. Every issue is listed in the report.
Project · RaumBIOS
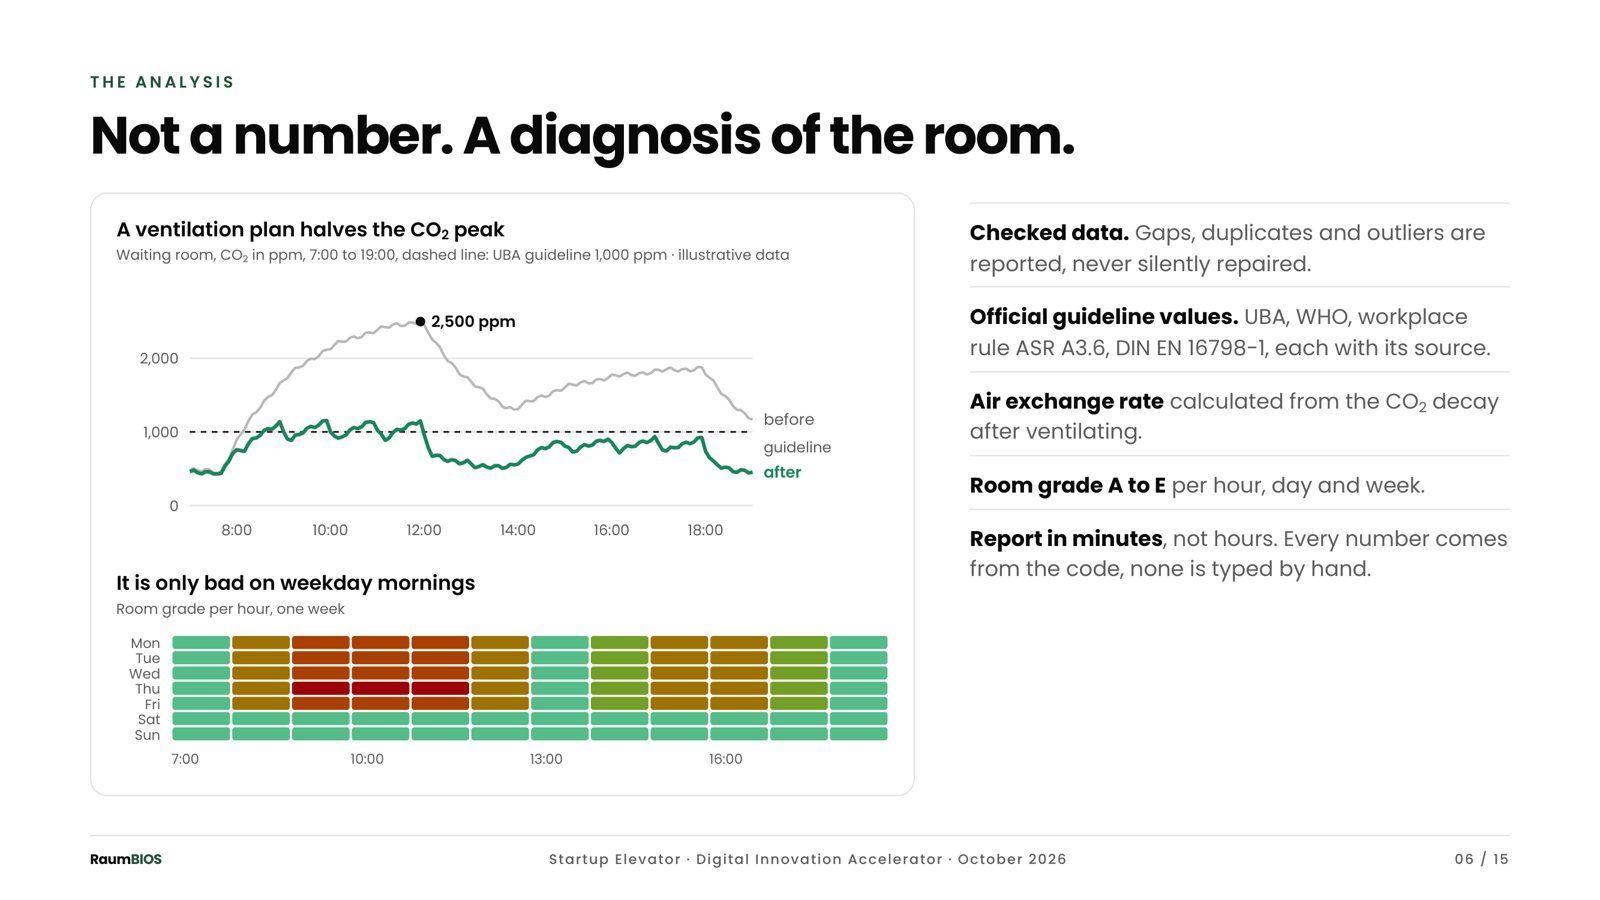
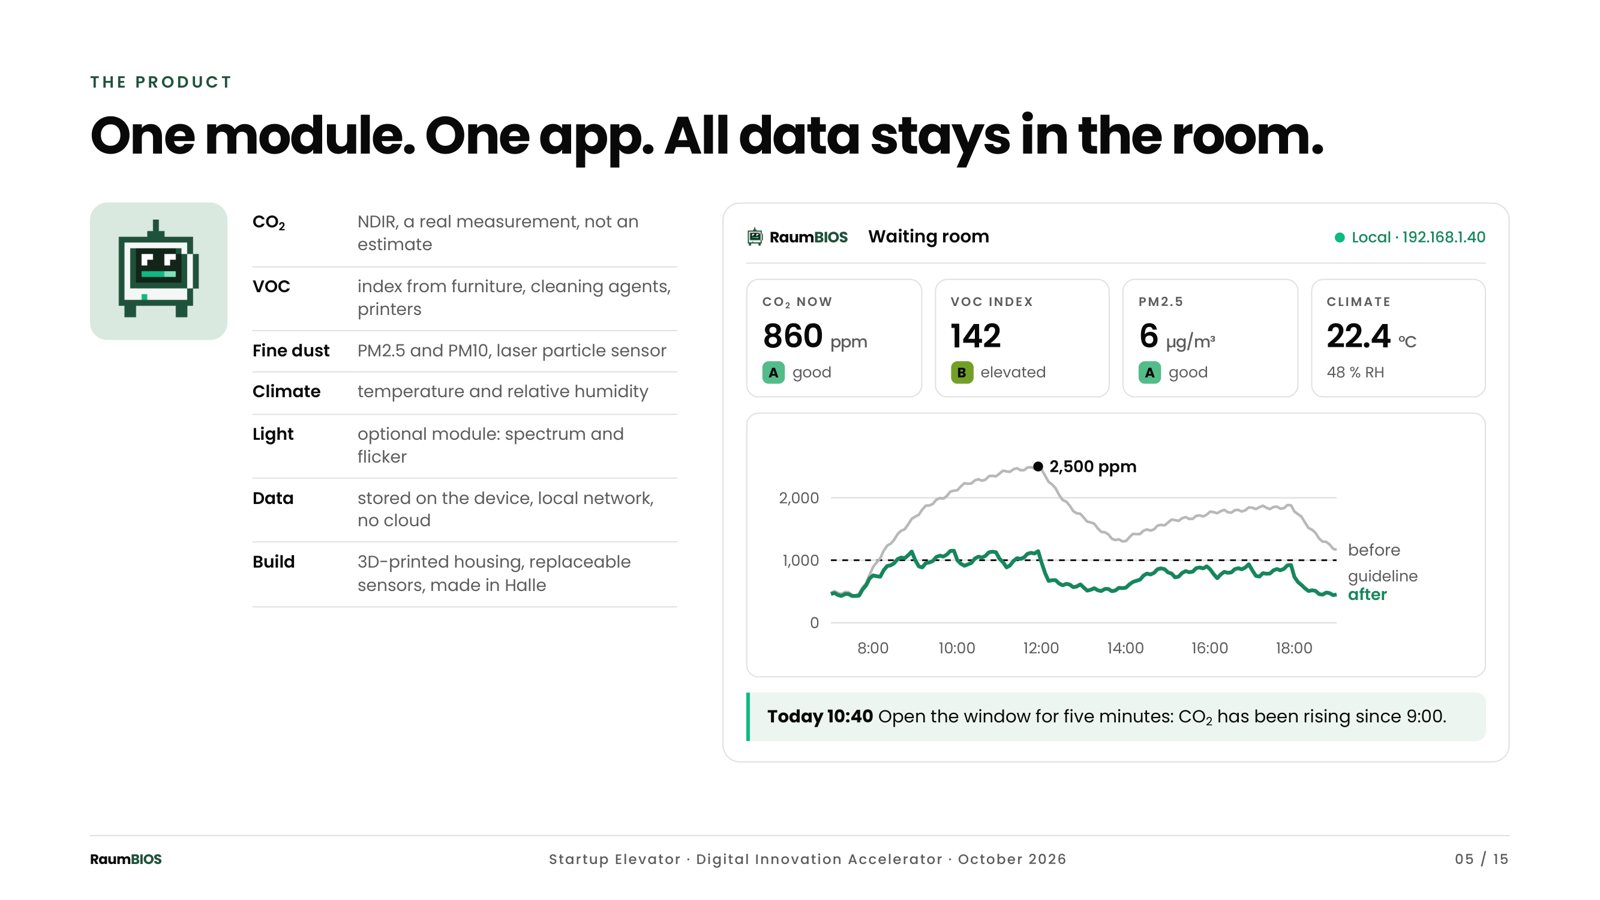
RaumBIOS measures the air in a room around the clock: CO₂, fine dust, temperature and humidity. My job was what comes next: turning thousands of readings into a clear answer that anyone can understand.
Own project, grown out of J&B Raumbiologie, in progress. All examples on this page use sample data.
What I built
The analysis detects duplicate timestamps, impossible values and gaps on its own. It never repairs anything silently. Every issue is listed in the report.
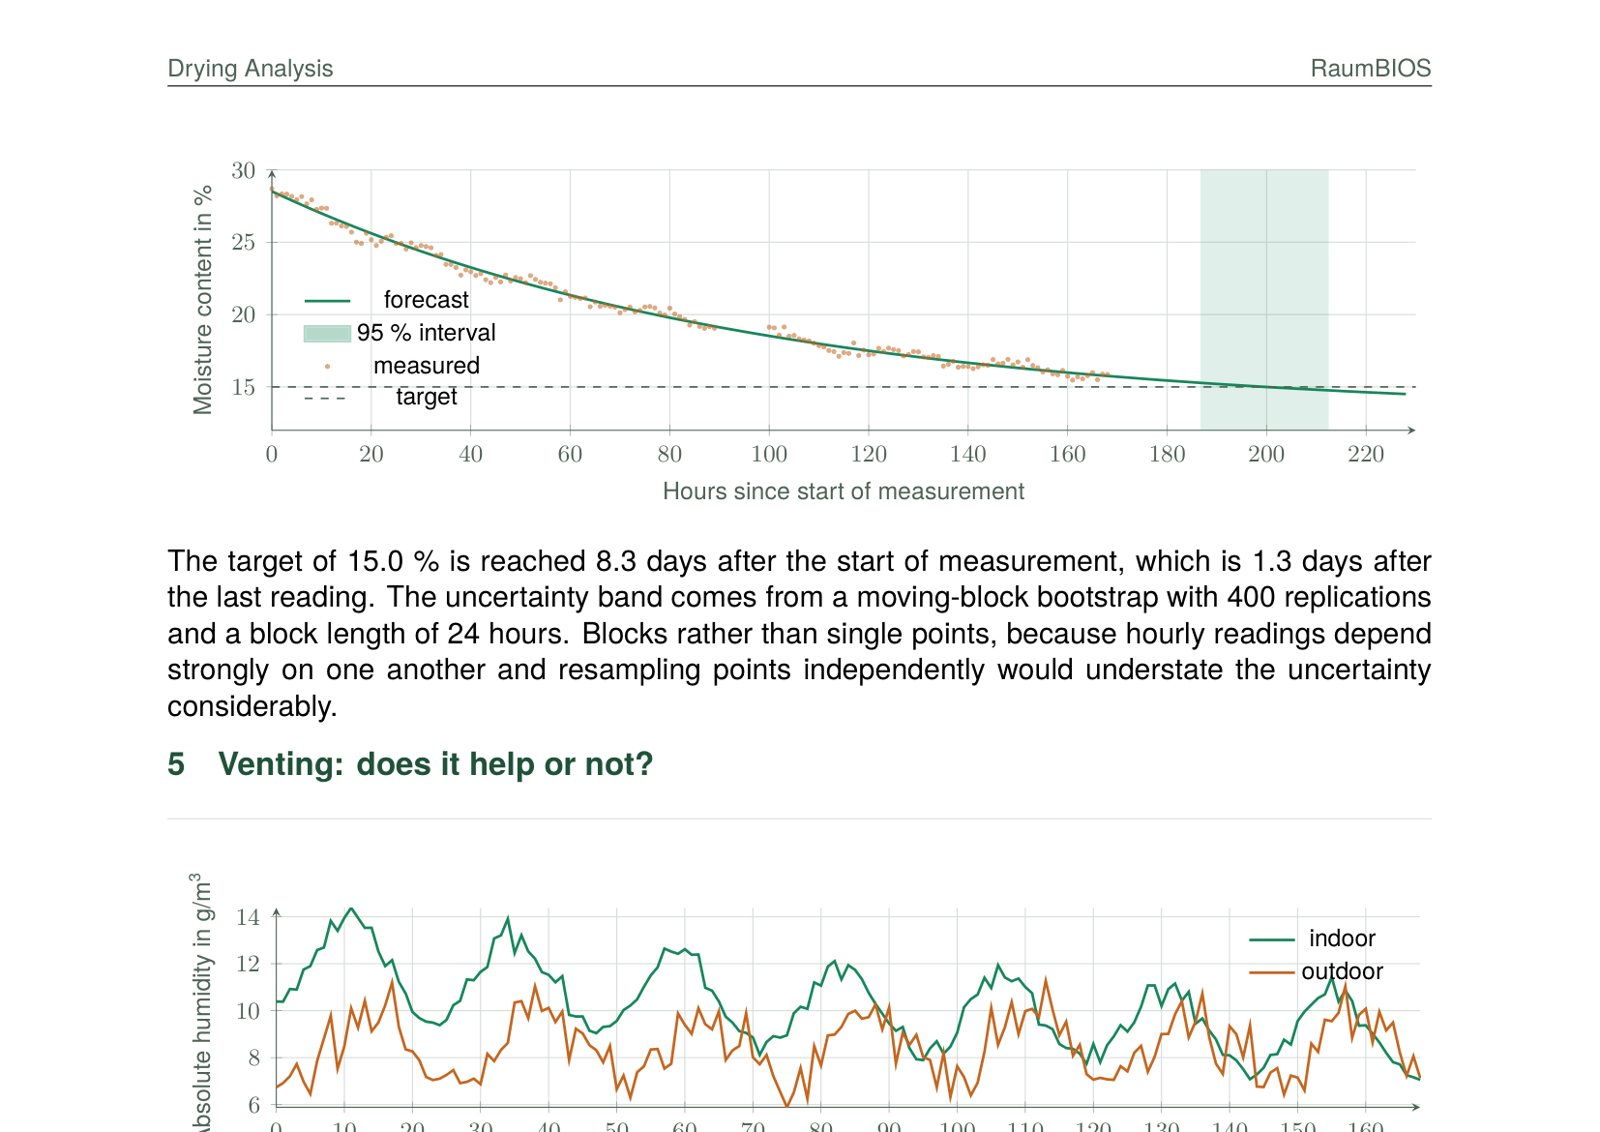
How fast does a screed floor dry after water damage? The analysis fits the drying curve and forecasts when the target is reached, with an honest range instead of a single date.
Hourly readings are strongly correlated. A block bootstrap accounts for that. A simpler method would understate the uncertainty.
Measurement file in, finished PDF out. No number is typed by hand, and a built-in test checks every time that the analysis recovers known values.
For your company
Sensor, till and machine data follow the same rules: check first, then model, then show it clearly. That's how I work with your data too.